
Table of Contents
Measurement
Definition: It is a method by which physical parameters can be transformed into meaningful numbers. In this process, we compare physical parameters to an accepted predefined standard.
A generalized measurement system
The block diagram of the generalized measurement system is shown below:
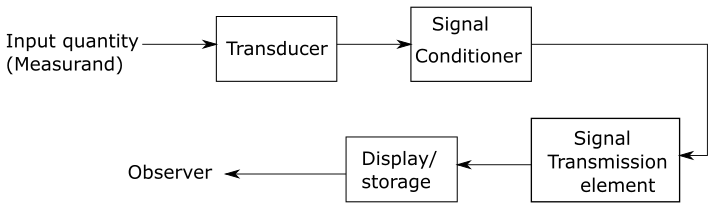
A generalized measurement system consists of the following elements as shown in the figure above
(i) Transducer: A transducer is one that transforms the measurand into a usable electrical output.
(ii) Signal conditioner: It is used to convert the transducer output into an electrical quantity suitable for control, recording, and display.
(iii) Signal transmission element: The transmission of data between one another is done by the signal transmission element.
(iv) Display: It displays the required information about the quantity to be measured i.e measurand.
Measuring Instrument
It may be defined as a device for determining the value or magnitude of a quantity or variable. Example- Multimeter , Voltmeter, wattmeter etc.
Characteristics of Instruments
It consists of two basic characteristics.
- Static Characteristics
- Dynamic characteristics
Static Characteristics
These are the characteristics of the instruments that describe the response of an instrument when the input to the instrument is constant or changes very slowly.
An instrument has the following static characteristics:
Accuracy
It is defined as the degree of closeness of the measured value to the true value of the measurand.
Measured Value: It is the value of the unknown parameter indicated by the instrument.
True Value: It is the theoretically accurate value of an unknown quantity.
Precision
It is defined as the degree of closeness of measured values to each other when a parameter is measured n number of times.
It is not necessary that a precise instrument be accurate, but an accurate instrument should be precise. Precision can mathematically be given as:
{\displaystyle P \;=1-\left|\frac{x_n\;-\;\overline{x_n}}{\overline{x_n}}\right|}
Where p= precision
xn= value of nthmeasurement.
{\displaystyle \overline{x_n}\;=} Avergae of the set of measured value.
Numerical: The table shows a set of 5 measurements recorded in a laboratory, Calculate the precision of the third measurement.
| Measurement Number | Value of Measurement |
| 1 | 49 |
| 2 | 51 |
| 3 | 52 |
| 4 | 50 |
| 5 | 49 |
Solution: The average value for the set of measurements is
{\displaystyle\overline{x_n}=\frac{Sum\;of\;reading}{No.\;of\;Experiment}\;}
{\displaystyle =\frac{49+51+52+50+49}5=\frac{251}5\;=50.2}
The value of 3rd measurement is
Xn =52 , n=3
so precision ,{\displaystyle P \;=1-\left|\frac{x_n\;-\;\overline{x_n}}{\overline{x_n}}\right|}
{\displaystyle =1-\left|\frac{52\;-\;50.2}{50.2}\right|\;=1-\left|\frac{2.2}{50.2}\right|\;=0.962\;=\;96.2\%}
Resolution or discrimination
When we increase non-zero input slowly, it is seen that output does not change until input exceeds a certain value, this increment is called Resolution or Discrimination. In other words, it is referred to as the smallest change in the input that an instrument can detect.
Numerical: A 0-100V Voltmeter has 200 divisions and the scale can be read up to 1/2 of a division. Determine the resolution of the meter in volts.
solution: Range of Voltmeter =0-100V
Division on Scale=200
The value of 1 scale division=100/200 =0.5
Minimum voltage that can be read on voltmeter is =1/2 x 0.5 =0.25V
Hence resolution of voltmeter= 0.25V
Threshold
It is the minimum input that results in a change in the output of the instrument. Resolution depicts the smallest measurable change in input while Threshold depicts the smallest measurable input.
Dead Zone
It is the range of input for which the instrument does not show any change in output.

Static error or Absolute error
The difference between the measured value (Am) and the true value (AT) of the unknown quantity is known as the absolute error of measurement(𝛿A or ɛo).
{\displaystyle \delta_A\;=\left|A_T\;-A_m\right|}Relative error or percentage error
the relative error is the ratio of absolute error to the true value of the quantity to be measured.
{\displaystyle Relative\;error\;(\varepsilon_r)\;=\;\frac{\delta_A}{A_T}=\frac{Absolute\;Error}{True\;value}}Sensitivity
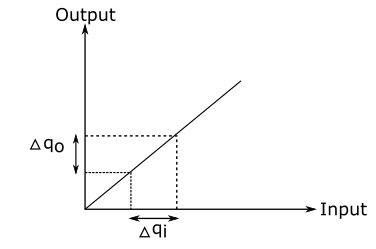
It is defined as the ratio of change in output of an instrument to a change in the value of the quality to be measured.
Mathematically it is given as:
Senstivity, {\displaystyle S\;=\;\frac{Change\;in\;output\;signal}{change\;in\;input\;Signal}\;=\frac{\triangle q_o}{\triangle q_i}}where ∆qo & ∆qi are the values of output & input signals respectively.
Numerical: If a change of 8 Ω in the unknown arm of the Wheatstone bridge is required to produce a change in deflection of 4.8mm of the galvanometer. Determine the sensitivity and deflection factor of the galvanometer.
Solution: Magnitude of change in output= 4.8mm
The magnitude of change in input= 8Ω
Senstivity={\displaystyle\frac{Change\;in\;output\;signal}{change\;in\;input\;Signal}}= 4.8/8 = 0.6mm/Ω
Deflection factor= 8/4.8 = 1.67Ω/mm
Repeatability
It refers to the degree of closeness of measured values to each other while measuring the same input & when the conditions under which measurement is done is kept constant. The conditions are as follows:
- Measurement should be made by the same observer and by using the same instrument.
- Ambient conditions like temperature, pressure, etc should be maintained or kept constant.
- All the measurements should be done in a relatively short span of time.
Reproducibility
It refers to the degree of closeness in measured values of the same input when measurement conditions are changed(only the observer or the ambient conditions may change.)
Linearity
An instrument is said to be linear if the output of the instrument varies or changes linearly with a change in input.
Drift
It is an undesirable change in output over a period of time when there is no change in input.
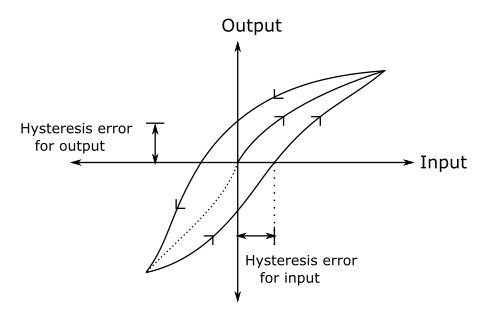
Hysteresis
Non-coincidence of loading and unloading curve of an instrument.
- Loading– when the input is increased from 0 to max.
- Unloading– When the input is decreased from max to zero.
Dynamic Characteristics
These are the characteristics that describe the response of an instrument when the input changes rapidly.
An instrument has the following dynamic characteristic:
- Speed of response ——–> Desirable
- Lag ——–> Undesirable
- Fidelity ——–> Desirable
- Dynamic error ——–>Undesirable
- Speed Of Response: The quickness through which an instrument reacts to the changes in the measured quantity is called as the speed of response of that instrument.
- Lag: It is the delay in the response of an instrument to any change in the input quantity being measured.
- Fidelity: It is defined as the ability of the system to reproduce the output without any dynamic error from the given input. It is used for the faithful reproduction of measured variables.
- Dynamic error: If the static error is assumed to be zero then a dynamic error is defined as the difference between the true value of a quantity changing with time & the value indicated by an instrument.
More Related articles
Hi, overall it’s a good article you provided a piece of good information