This section of Control Systems Multiple Choice Questions and Answers (MCQs) focuses on the “ Polar plot and Nyquist plot ”. These MCQs are very helpful for the preparation of University exams, Engineering exams, and various competitive exams.
CONTROL SYSTEM – POLAR AND NYQUIST PLOT MCQs
1. Polar plot is a plot between magnitude and phase angle where angular frequency (ω) is varied from:
- ∞
∞ to 0
∞ to + ∞
∞
Explanation:-In polar plot, the magnitude of G(jω)H(jω) is plotted against the phase angle of G(jω)H(jω) by varying angular frequency (ω) from ∞.
2. Which among the following is used to draw the Nyquist plot.
Explanation:- Open-loop transfer function is used to draw the Nyquist plot and through which we obtain the stability of the Closed-loop system.
3. In a polar plot, if the critical point(-1+j0) is within the plot then the system will be:
Explanation:- If the polar plot encloses the point (-1+j0) then |G(jω)H(jω|ω=ωpc>1. so G.M< 0dB i.e GM is negative. It means the system is unstable.
4. The frequency at which the polar plot crosses the negative real axis is known as:
Explanation:- Resonance frequency: The frequency at which the maximum magnitude of the transfer function(Resonance peak) occurs is known as resonance frequency
Gain crossover frequency: The frequency at the point of intersection of the polar plot and circle of unity radius with origin (0,0)as the center is known as Gain crossover frequency.
Phase crossover frequency: It is the frequency at which the polar plot crosses the negative real axis.
5. If two poles at origin are introduced in the open-loop transfer function of a system then the same polar plot is shifted by :
Explanation:- – 1/s2 =1/jω2.So angle is given as -2tan-1∞ = -180°.Here angle is negative, so the rotation will take place through 180° in a clockwise direction.
6. Which of the following method doesn’t give Relative stability of the system?
Explanation:- Routh Hurwitz criterion gives only absolute stability of the system while Bode plot, polar plot, and Nyquist plot give absolute as well as the relative stability of the system with the help of gain margin and phase margin.
7. If there is one open-loop pole in the right half of s plane then for stability, how many times Nyquist plot must encircle the critical point -1+j0:
Explanation:- For stability, the Nyquist plot must satisfy the condition N=P, where N is the number of encirclement of the critical point -1+j0 and p is the number of poles of G(jω)H(jω) in the right half of s-plane. Here it is given that p=1 then for stability N=P =1, as N is positive so the Nyquist plot must encircle the critical point-1+jo once in the Anticlockwise direction.
8. If the number of the open-loop pole of a system in the right half of the s-plane is 2 and the Nyquist plot encircles the critical point -1+jo once in anticlockwise direction then the number of poles of the closed-loop transfer function lie on the right half of the s-plane:
Explanation:- The formula to calculate the number of closed-loop poles in the right half of the s-plane is Z=P-N
where Z=The number of closed-loop poles in the right half of the s-plane.
N =The number of encirclement of the critical point -1+j0.
P is the number of poles of G(jω)H(jω) in the right half of the s-plane.
So here p=2 and N =+1(+ sign is due to anticlockwise direction) then Z=P-N=2-1=1.
Hence there is 1 pole of the closed-loop transfer is in the right half of the s-plane, so the system is Unstable.
9. Nicolas chart is used to determine:
Explanation:- Nicolar chart is a graph between Magnitude (dB)and phase angle (degrees) i.e M=|G(jω)|dB and N=∠G(jω)degree. It is superimposing of gain phase plot of Nichol’s chart to study close-loop frequency. Each and every time it repeats its value after an interval of 360°.
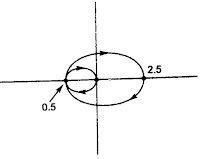
10. The Nyquist plot of an open-loop transfer function is shown below.The gain margin is
Explaination:- The formula to calculate the Gain margin (GM)=-20 log10|G(jω)H(jω|ω=ωpc.Here in the given plot |G(jω)H(jω)|=0.5 at phase cross over frequency (ωpc). So GM=-20 log10(0.5) =6dB.
More Related MCQ’s


