
This section of Control Systems Multiple Choice Questions and Answers (MCQs) focuses on the “ Bode plot ”. These MCQs are very helpful for the preparation of University exams, Engineering exams, and various competitive exams.
CONTROL SYSTEM – BODE PLOT MCQs
1. Bode plot consists of two separate plots i.e Magnitude plot and phase plot which is represented as:
Explanation:- Bode plot is a logarithmic plot and consist of two plots : (i)magnitude plot: A plot of the logarithmic(base 10) of magnitude (in decibel )of a sinusoidal transfer function G(s) versus frequency in logarithmic scale (log w) i.e 20log|G(jw)| versus log w (ii)Phase plot: A plot of phase angle in degree versus frequency in logarithmic scale (log w) i.e, phase shift versus log w.
2. The intersection of the initial slope of magnitude plot of bode plot with the 0dB axis is determined by:
Explanation:- Intersection of initial slope of magnitude plot with 0db axis is determined by K1/N , where N is the type of the transfer function. The type of the system is the number of poles at origin, if for example, the number of poles at origin is 2 then the type of the system will be 2.
3. For a type-2 system, the asymptote at alower frequency will have a slope of :
Explanation:- The equation of straight line 20nlog w dB has a slope of 20n dB/decade that means the slope of the line is 20n dB per unit change in log w. A unit change in log w means log(w2/w1) = 1 or w2 = 10w1 ,this range of frequency is called a decade.The range of frequency w2 = 2w1 is called an octave, since 20log2=6dB, the slope of equation 20ndB/decade could also be expressed as 6ndB/octave.so for type 2 system, means this system has 2 poles at the origin and we know that 1 pole introduces -20db/decade or -6dB/octave slope therefore 2 poles introduce initial slope = -6-6= -12dB/octave.
4.The log-magnitude plot of a constant is :
Explanation:- The magnitude of a constant term k in dB is given as 20logk= constant. so the magnitude is independent of log w and also the phase angle is always zero. Therefore log magnitude plot of a constant term k is a straight line parallel to the 0dB axis.
5. An octave frequency range is specified by:
- (w2/w1)
= 10
(w2/w1) = 2
(w2/w1) = 8
-
ANSWER= (B) (w2/w1) = 2
Explanation:-A unit change in log w means log(w2/w1) = 1 or w2 = 10w1 ,this range of frequency is called a decade.The range of frequency w2 = 2w1 is called an octave.
6. A system is said to be a minimum phase system if the transfer function has :
Explanation:- A system is said to be a minimum phase system if the transfer function has no poles and zeros in the right half of the s-plane. If any of the poles and/or zeros lie in the right half s-plane then the system is called a non-minimum phase system.
7. The initial slope of the magnitude plot of the transfer function G(s)= 50/s2(1+0.25)(1+0.1s) is:
Explanation:- for type n system ,the initial slope of th magnitude plot is given as -20n dB/decade.Here the given transfer function is of type-2 ,so n=2.Hencethe initial slope =-20n dB/decade=-20x2dB/decade =-40dB/decade.
8. The corner frequencies (in rad/sec) of the open loop transfer function of a system is given as G(s)= 16(1+0.5s)/s(1+0.125s)(1+0.1s) are:
Explanation:- When the poles or zeros of the transfer function are written in (1+TS) form then the corner frequency w=1/T. So in the given transfer function there are 3 corner frequencies i.e w1= 1/0.5=2rad/sec ,w2= 1/0.125= 8rad/sec , w3=1/0.1= 10rad/sec
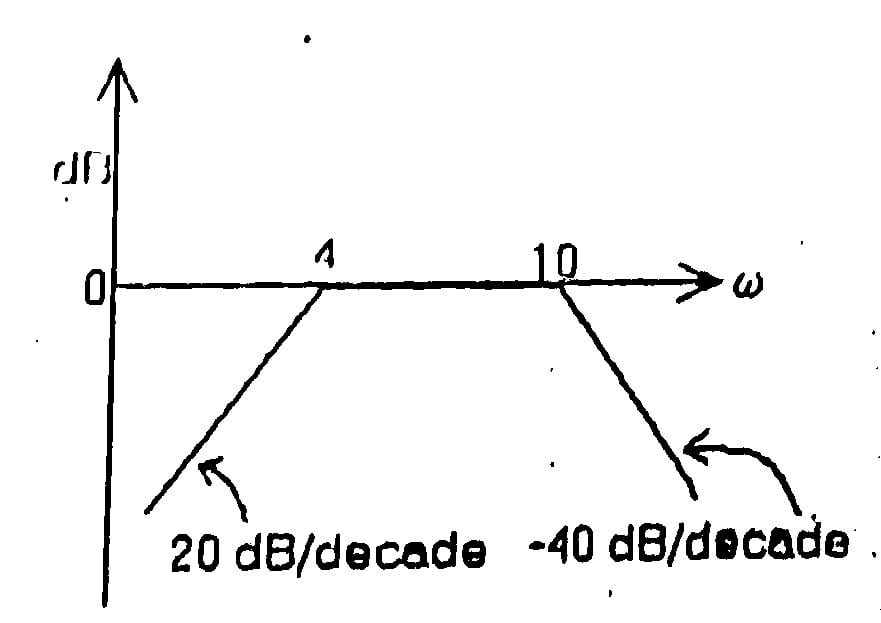
9. The transfer function of the given bode plot is:
- )2
)2
Explanation:- The initial slope of the plot is +20dB/decade so there is a zero (s)in the transfer function,and then at corner frequency 4 ,slope has become 0dB/decad so there is a pole (1+s/4) and then at corner frequency 10,slope becomes -40dB/decade that means there is a dual pole (1+s/10)2 .Initial slope cuts the 0dB axis at w=k1/N where N is the type of the system.since n= -1 ,so k= 0.25
10. Bode plot of the transfer function G(s)=s2 is :
Explanation:- The given transfer function has 2 zeros at the origin and we know that one zero introduces a slope of 20dB/decade and phase shift of π/2 then 2 pole introduces a slope of +40 dB/decade and phase shift of π.
More Related MCQ’s